


Russia, Saudi Arabia, + the entire world, except the US, using all available technologies, have not increased oil supply to the importing countries in 17 years.
Fracking, Debt, Lies, and Damned Lies. Part 1.

In my last post I put a spotlight on the idea of Net Purchasable Oil, the total amount of oil and liquid fossil fuels available to purchase each year from all exporters together. (Exporter total production - Exporter total consumption) Net Purchasable Oil peaked in 2005, remained flat till 2018, then began plunging, before the pandemic, and shows no sign of recovery.

These posts explore a troubling idea: as the amount of energy consumed tracks extremely closely with economic growth, and since we require economic growth to pay debt, does a declining net energy supply for all importing nations guarantee the end of their financial system?
By focusing attention on Net Purchasable Oil, rather than EROEI, gross production, peak oil, renewables, etc, I hope to illuminate little known details about the debt crisis facing the importing nations, especially the West, and even more specifically, the United States.
Continuing from the first post, if Net Purchasable Oil peaked in 2005 and the logic holds, then why hasn’t the economy collapsed already? In this post I introduce the first of three actions that kicked the Net Purchable Oil Crash down the road to today.
How US Fracking affected global Net Purchasable Oil since 2005

Figure 2 illustrates that since 2007 pretty much all increase in oil supply from all importing nations comes from the US.
Figure1 shows Net Purchasable Oil from all exporters, while Figure 2 show total oil production of all importers. Together, Figure 1 and 2 show that Russia, Saudi Arabia and the entire world, except the US, using all available technologies, have not been able to increase oil supply to the importing countries as a whole in 17 years.
Let that sink in.

The black line above illustrates the almost shocking increase in US oil production, due almost entirely to hydraulic fracturing. The red line above shows the impact of this dramatic production increase on US imports. Wow, quit the drop. Note the scale on the left. How did this decrease in imports affect the other importing nations?
To make this point clear, compare the two figures below. (figure 1 reposted for convenience)


Figure 4 shows that the decrease in US purchases of Net Purchasable Oil from 2005 to 2022 allowed all other importing countries together to continue to have an increasing oil supply.
Taken together, figures 1 to 4 illustrate that pretty much the only increase in Net Purchasable Oil for all importing nations worldwide since 2005, not including has come from US fracking.
How did the US fare during the same time period?
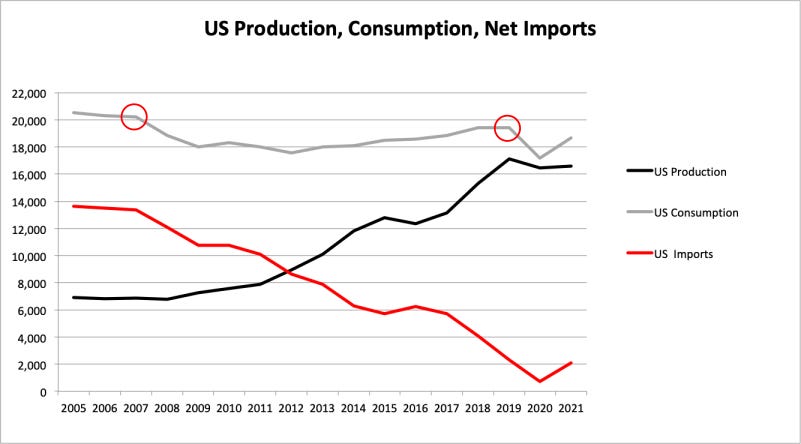
The grey line above illustrates a profound truth about the US economy. Despite the almost shocking increase in oil production from 2005 to 2018 in the US, the US economy consumed - less - oil from 2005 to 2019.
The US economy ‘ate’ all of the reduction in global Net Purchasable Oil supply from 2005 to 2022.
Again, let that sink in. All importing nations as a whole had an increasing oil supply from 2005 to 2018, due to US fracking, while oil consumption in the US itself declined during the same time period.
If you can’t have economic growth without increase amount of energy, and you can’t pay debt without economic growth, they why hasn’t the US collapsed due to a lack on increased oil supply for 17 years?
Debt, Lies, and Damned Lies.
My next post focuses the spotlight on the correlation between US money supply and the inflection points in US oil consumption in 2007 and 2019, circled in red in Figure 5 above.
I may be comparing apples to oranges but one reason to NOT overproduce is that prices are set at the margin, and overproduction will lead to a price crash, which tends not to be an issue for legacy wells, but for newer technologies (e.g. tar sands) it's economic devastation.
The markets like price stability.